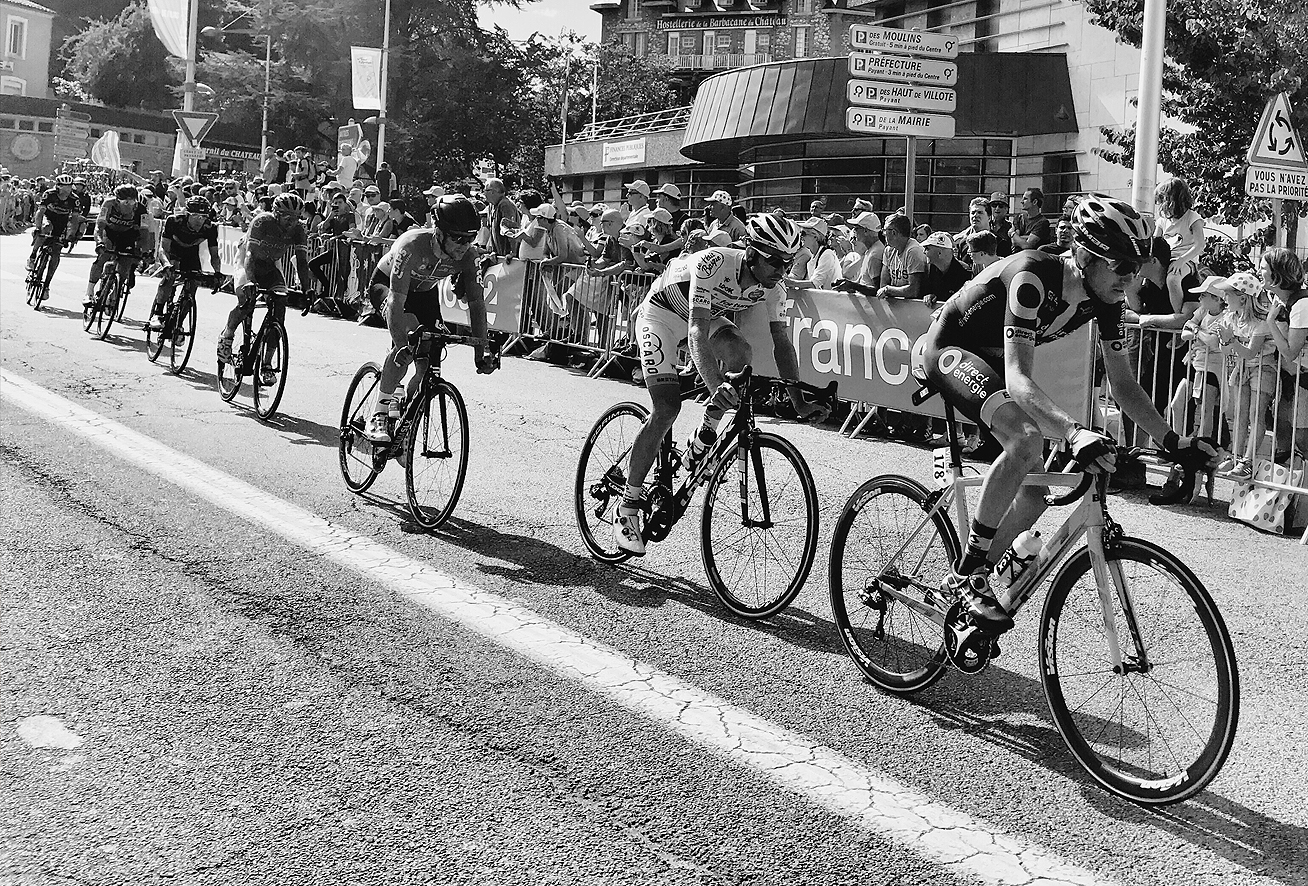
I have a confession to make, well two actually – data doesn’t turn me on and I haven’t ridden a push bike on a road for some time. All the more reason to spend a couple of days with Dimension Data at the Tour de France.
Before I continue, let me justify the above statement. It’s not the data that turns me off, it’s the process. I have something close to a panic attack when I open a spreadsheet. What I love are the qualities of well presented data. This isn’t a plea to make better pie charts, but making them easier to consume.
As for my second confession. I like bikes, and can appreciate their aesthetic appeal, amazing technological build and production and how they offer a better cardio workout than sitting on a bus. But I’d ride in the safety car!
Dimension Data invited me to put aside my indifference by combining data and cycling and what better way to do this than at the world’s premier pedallathon – the Tour de France.
There was of course method in their madness as Dimension Data is the South Africa headquartered IT solutions giant responsible for sweeping the Tour de France into the modern age with a stunning network of connectivity, data analytics and visualisation.
This winning partnership began its monumental journey a little over three years ago when Dimension Data had just six months to turn an initial conversation into state-of-the-art live data broadcast material!
Now in the third year of the partnership, Dimension Data plays a major role in the technology behind the Tour de France experience - learn more on how technology is bringing the race into the 21st century.
To put this into context, the first year of the relationship saw Dimension Data handle data analytics for the race. By the second year, it also took control of the sensors on each bike. This allowed each bike to seamlessly transmit data via the cloud to the race nerve centre - Dimension Data’s big data truck. From there it went live to an ecosystem of broadcasters and sports commentators as well as to a dedicated team of data experts in London responsible for producing data visualisations for the Tour’s social media channels. This year Dimension Data brought some new technologies into the mix in the form of predictive analytics and machine learning which it used to predict likely stage results, adding deeper insight and colour to the race commentary with the ultimate goal of increasing the engagement of cycling fans.
Dimension Data's mobile nerve centre: The Big Data Truck
The system proved to be more accurate than even Dimension Data’s experts anticipated. Over the 21 stages of the race, it knotched up over 70% accuracy for predicting the Top 5 riders. However, they were quick to point out that the objective was not to create a perfect model for race predictions - for or a live sporting event (with crashes, injuries and good old mother Nature to contend with) that would be impossible and detract from the exciting and dynamic nature of the race.
What we can be sure of though is that as these technologies consume and learn from more and more data, they will continue to improve and help people to excel in whatever field – from sports commentating to medicine to teaching.
There are very few events in the sporting calendar that demand such synergy between competitors, their equipment and all team members but the sheer scale of the Tour de France organisation and logistics lends itself to automotive challenges such as the Dakar Rally – actually in Amaury Sport Organisation (A.S.O.)’s stable alongside the Tour de France.
As the demand for social broadcasts increases dramatically (the Tour de France video views rose from 6M to 55M between 2014 and 2016!) so competitive sport evolves to deliver appropriate content to a digitally native audience. New sporting series crying out for this include drone racing, Formula E and the fabulous combination of design, drama and artificial intelligence – Roborace. Watch this space as the next few years will see sports broadcasting provide an accelerated development platform that improves IoT for us all.
Until then, Dimension Data will continue to drive the Tour de France into the 21st century, and deliver live content to demanding fans around the world.
This article originally appeared on Dimension Data's Blog


